What's happened on the platform, version by version. A single page, updated regularly, designed with users in mind.
September 2026 Issue
● AvailableSeptember 24, 2026
Available on the platform—no action required on your part.
Reports ready for distribution, analyses and spreadsheets being worked on as drafts, and a Copilot that’s always there
This version generates written and illustrated reports—either one-time or recurring—allows you to version custom analyses and evaluation grids with a private draft and test conversations, opens Copilote from any page, enhances dashboards, and lets you import conversations in batches.
Reports
Written and illustrated reports, whether one-time or recurring
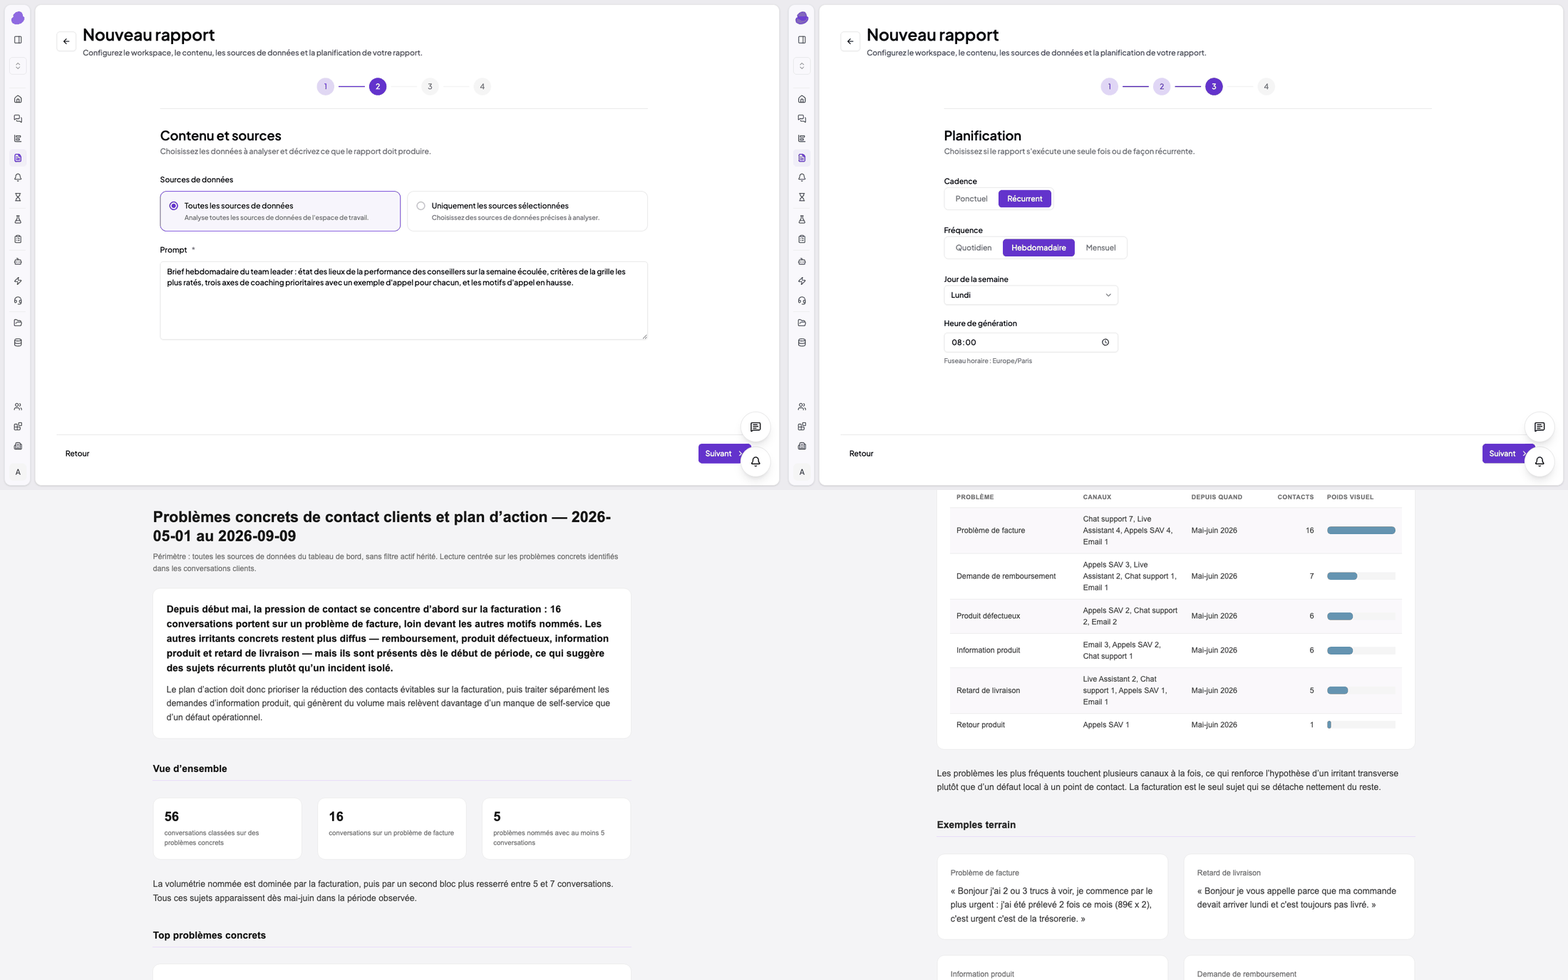
The report prompt, its weekly planning, and then the final document: a written summary, key figures, a table of issues by channel, and verbatim quotes.
Use Cases
Team Leader: Monday briefing at 8:00 a.m., the team's performance over the past week, the criteria where they fell short the most, and three areas for coaching, each illustrated with a call.
Quality Manager: the monthly report for the executive committee, overall score and its trend, breakdown of scores, and coaching initiatives undertaken.
Customer Relations Department: Quarterly overview of satisfaction levels, CSAT by channel, themes of low-rated feedback, and concrete examples.
Product or marketing team: a summary of the quarter’s pain points, reasons for contact, customer quotes, and emerging trends—to be shared as is.
Operations Manager: Weekly follow-up after the launch of an offer, including volumes by reason and newly identified issues.
Managing an Advisor: Individual Follow-Up Before the Review, Progress, Criteria for Downgrade, and Coaching Focus Areas.
A report is a written and illustrated document generated by the AI based on your data: it includes a summary, structured sections, key figures, tables, concrete examples, and recommendations, along with details of the methodology used (time period, filters, scope, and sampling). It can be created in four steps from the Reports page, or by entering a phrase into Copilot from a dashboard.
One-time, to answer a specific question, or recurring—daily, weekly, or monthly—scheduled for the time of your ritual.
Each run is saved on the Reports page, and the document can be shared via a link.
A report requested from Copilote reflects the scope displayed on the dashboard.
Profit
A deliverable that's ready to be read and shared, and that updates itself automatically as your meetings progress.
Co-pilot
Copilote opens from any page
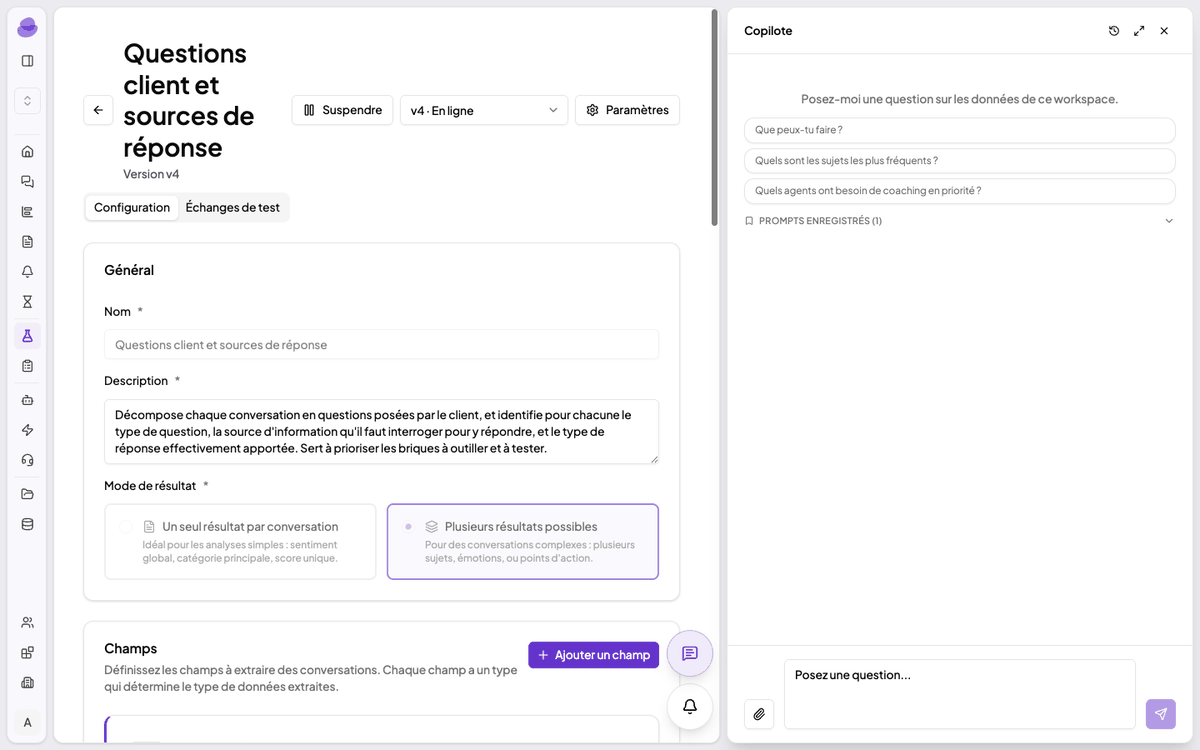
Copilote, opened from a personalized analysis, with suggestions tailored to the page.
The Copilot is present on almost every page of the platform, and it knows where it is. From a dashboard, it reads the displayed widgets and active filters; from an evaluation, it works on the open conversation; from a grid, it helps write the criteria. On pages that do not display numbers, it remains available but does not provide any figures.
Profit
One way to ask a question, no matter what screen you're on, with an answer that takes into account what you're looking at.
Use Cases
A supervisor reviews the call that led to a complaint and asks what could have been done to prevent it.
A set manager prepares his weekly update using his team's dashboard and asks what has changed this week.
A quality manager adjusts the grading scale before a grading campaign, discussing the criteria with the Co-pilot.
Well-crafted answers, ready to be shared
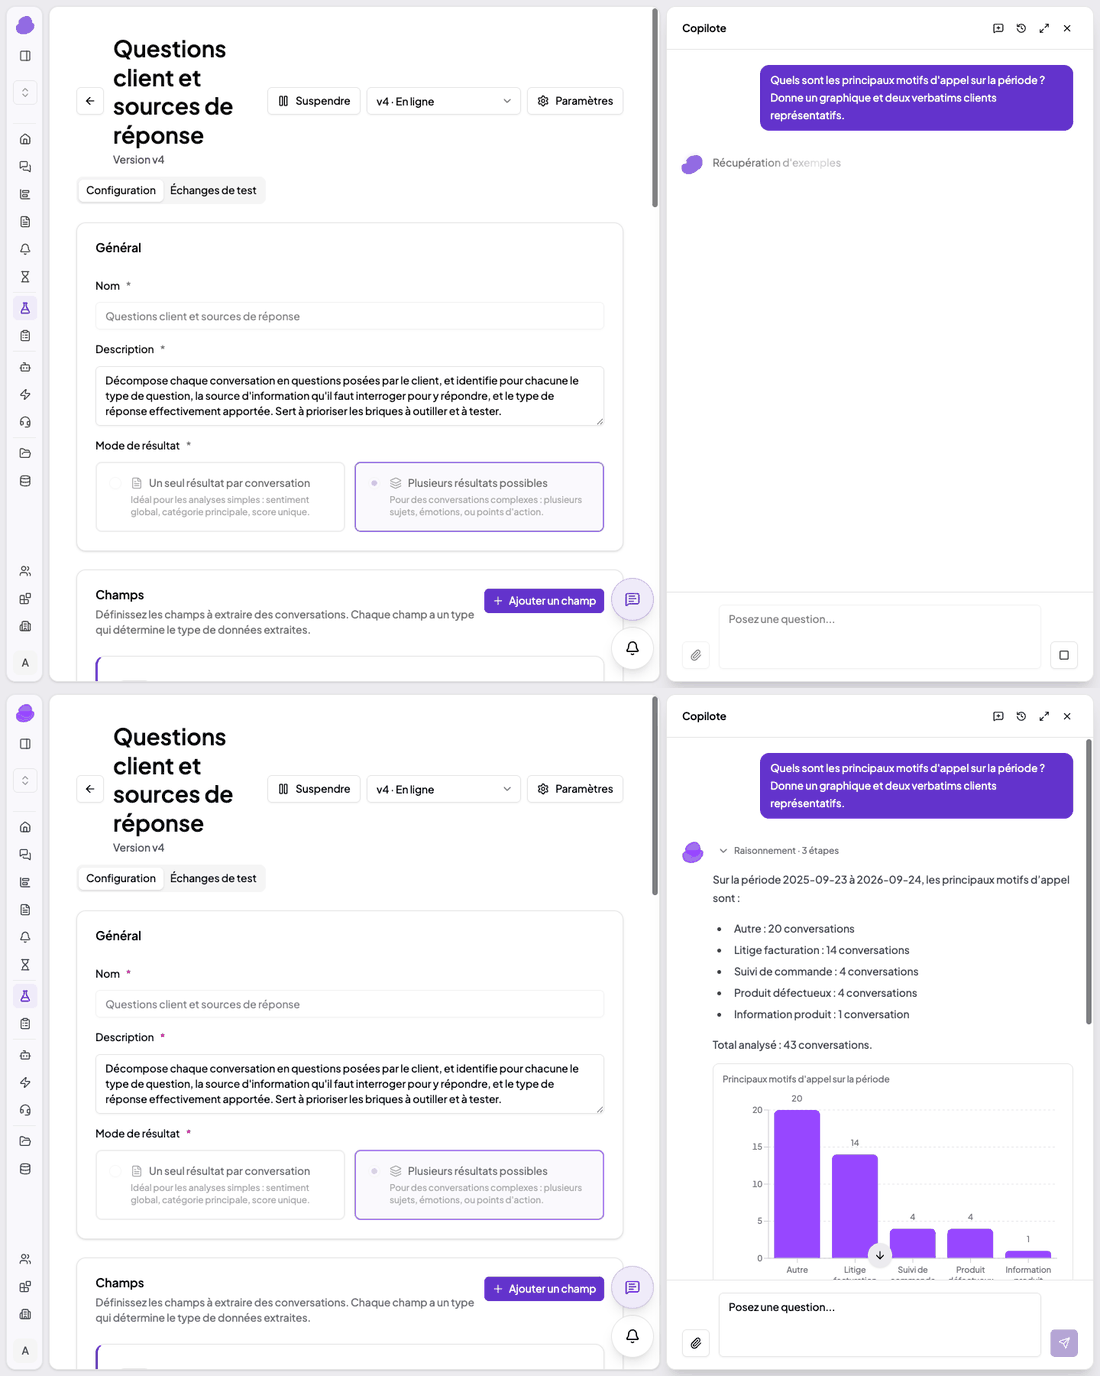
During the search, the timeline; then the answer, its graph, and the quoted verbatim responses, which are dated and clickable.
Each graph and each quote appears at the point in the text where it is mentioned.
Customer quotes are taken from the original conversation, are dated, and are clickable.
While he's searching, the Copilot explains what he's doing, step by step. Once the answer is written down, these steps fold into a collapsible line.
When the Co-pilot writes a report, a button appears below its response to open it, and it remains there when you reopen the conversation.
The Copilot identifies and names the filters on a section score or an additional score, and names the score behind an indicator when you ask it what a widget measures.
Profit
A response that is meant to be read from top to bottom and shared as is, with each statement supported by its own graph or direct quote.
Use Cases
A monthly quality committee meeting prepared in ten minutes: the drop in the score, its trend line, and the two verbatim quotes explaining it—all in the same thread.
A customer relations department is reviewing last week's report to present it to the executive committee.
An analyst verifies exactly what a metric measures before including it in a client report.
Report a problem or suggest an improvement via chat
If something isn't working—a button that doesn't respond, a page that won't load, or an export that isn't completing—just let Copilote know in the chat. It asks all the necessary questions at once, provides you with a summary, and forwards the issue to our teams, automatically attaching the page, active filters, and technical context. Feature requests follow the same process. You'll receive a confirmation in your notifications.
Profit
A bug reported in one minute—no screenshots or emails required—with everything our teams need to reproduce it.
Use Cases
The export button on a dashboard stops responding the day before a committee meeting: the report is sent along with the page and filters, and tracking is done without any back-and-forth.
A guest advisor is unable to open one of their evaluations: they report the issue directly from the relevant page, without going through their manager.
A business team wants a metric that it currently tracks in a spreadsheet and submits a request for it through the same channel.
Dashboards
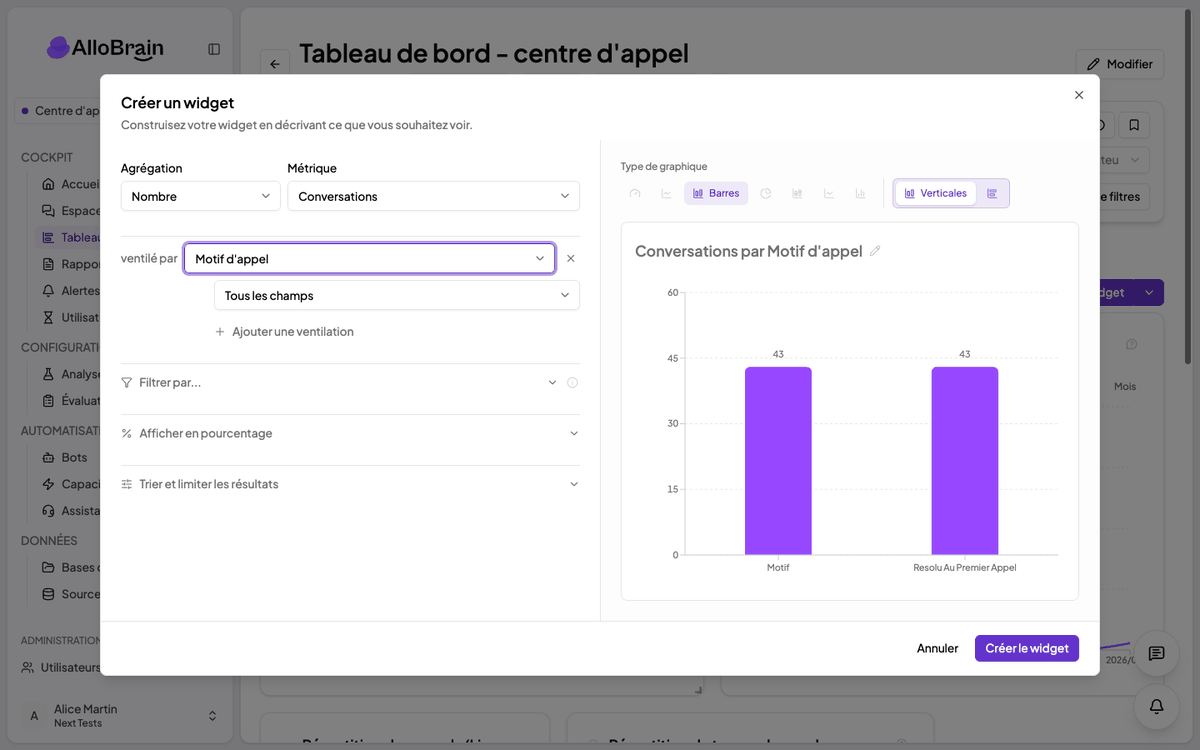
A graph based on a comprehensive analysis
In the widget wizard, select "One bar per field" for the chosen analysis.
A chart combines the various fields of a custom analysis—one bar per field—so you can see at a glance which ones stand out and compare them with each other before drilling down into the values for each one.
With a time axis, a curve for each field tracks its frequency over the period.
Clicking on a bar opens the field details, followed by its values and their subcategories, with a breadcrumb trail to navigate back.
A field added to the analysis appears in the existing charts.
Profit
An overview of an analysis in a single widget, with details available upon clicking.
Use Cases
An analysis of complaints by reason, goodwill gesture, and resolution on the first call: a single chart shows the proportion of each, followed by a breakdown of the reasons when clicked.
A post-survey in which each question is a field: track, week by week, which ones rank highest.
A new "intention to terminate" field added to the analysis appears in the existing charts without rebuilding the dashboard.
More readable charts
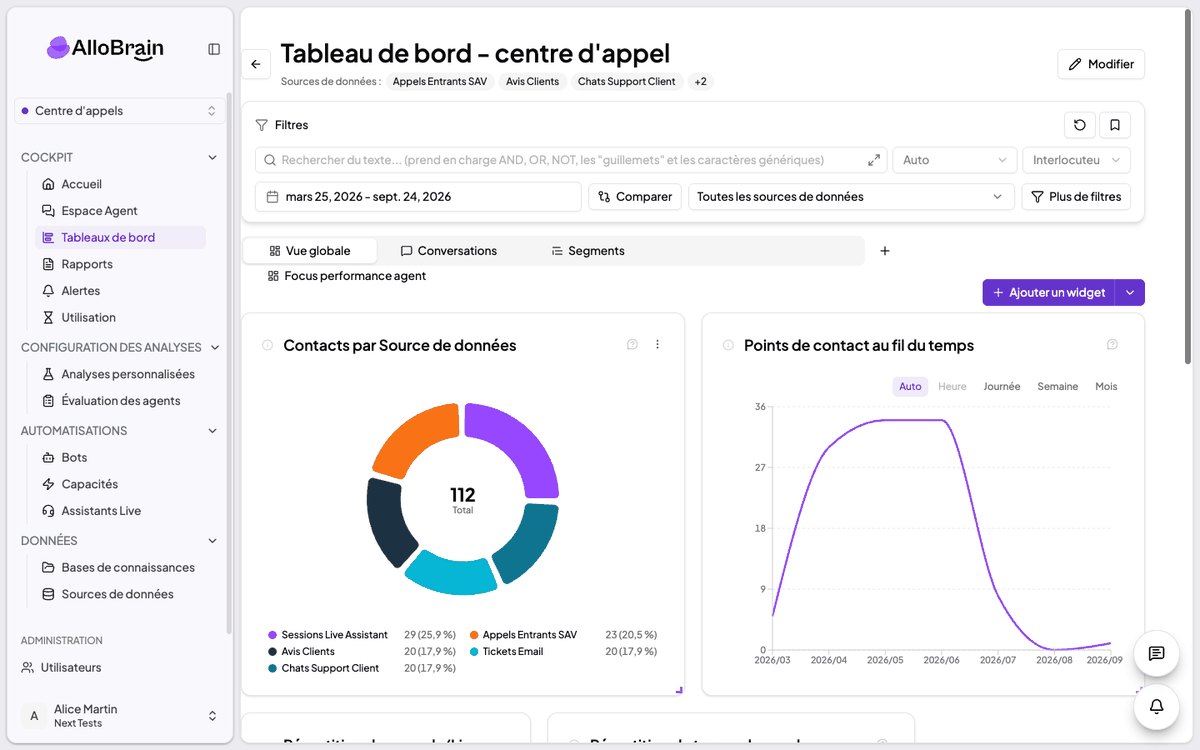
A dashboard displaying the charts: legend with values, full-height curve.
The charts on the dashboards have been redesigned to be easily understood at a glance.
The total is displayed above the stacked bars, and the value of each segment appears in the pie chart legend.
The text remains horizontal, a widget's title can span two lines, and the chart takes up the entire height of its card.
The bars can be arranged horizontally.
Profit
Graphs that are easy to read, whether projected during a meeting or displayed on a shared screen.
Use Cases
Present the dashboard to the committee without having to format it in another tool.
A list of the top ten reasons for calls, as it appears in the weekly report sent to the client.
Open-ended responses and customer feedback are processed through the filters
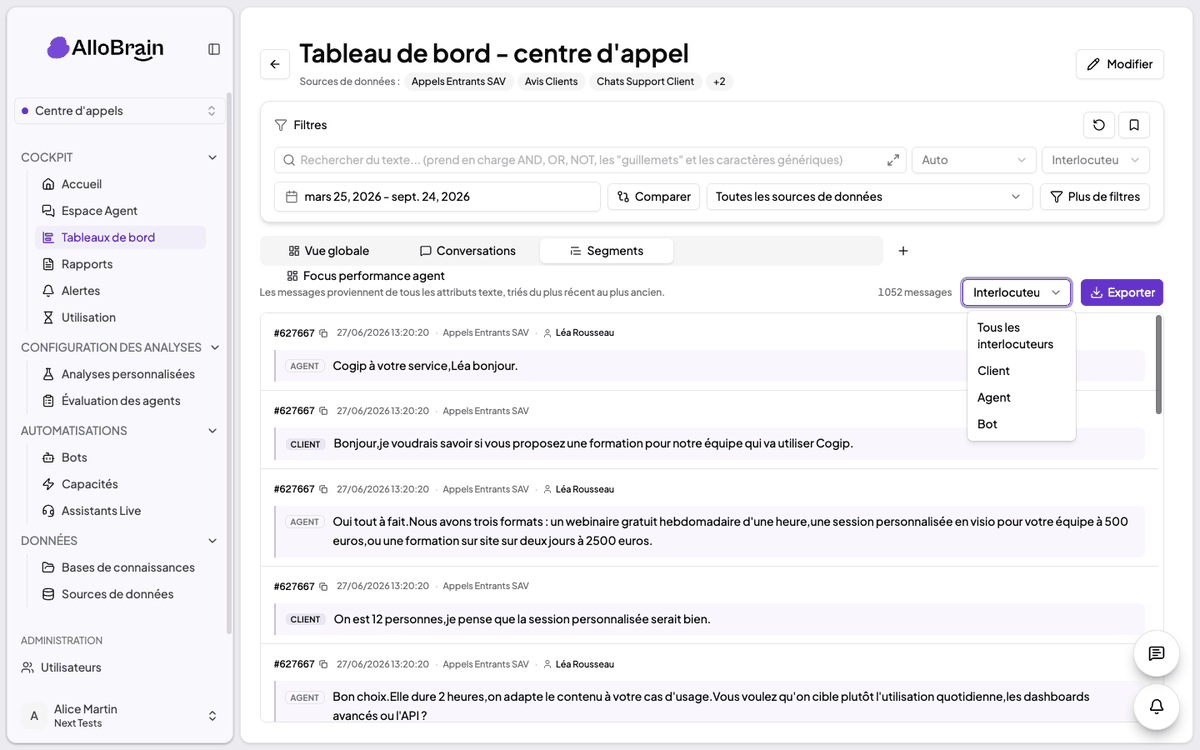
The speaker selector in the Segments tab.
A "filled" or "empty" filter applies to an open-ended question and can be pinned just like the others. The count of verbatim responses is limited to a specific question.
A speaker selector—whether for a customer, advisor, or bot—lets you filter out all but the speech that interests you, both in the segments tab and in the message-based charts.
Profit
Open-ended questions and customer feedback are becoming standard components of the dashboard, just like any other.
Use Cases
Measure the percentage of customers who leave a comment after a post-purchase survey, and review those comments separately.
Track mentions of “timeframe” only as spoken by the customer, for a logistics metric that does not count the advisor’s repetitions.
Identify the critics of an NPS survey who took the time to explain themselves.
Please note: The verbatim count now excludes blank responses, so the numbers may be lower on existing dashboards.
Analyses and Evaluation Grids
Versions and a draft for the analyses and worksheets
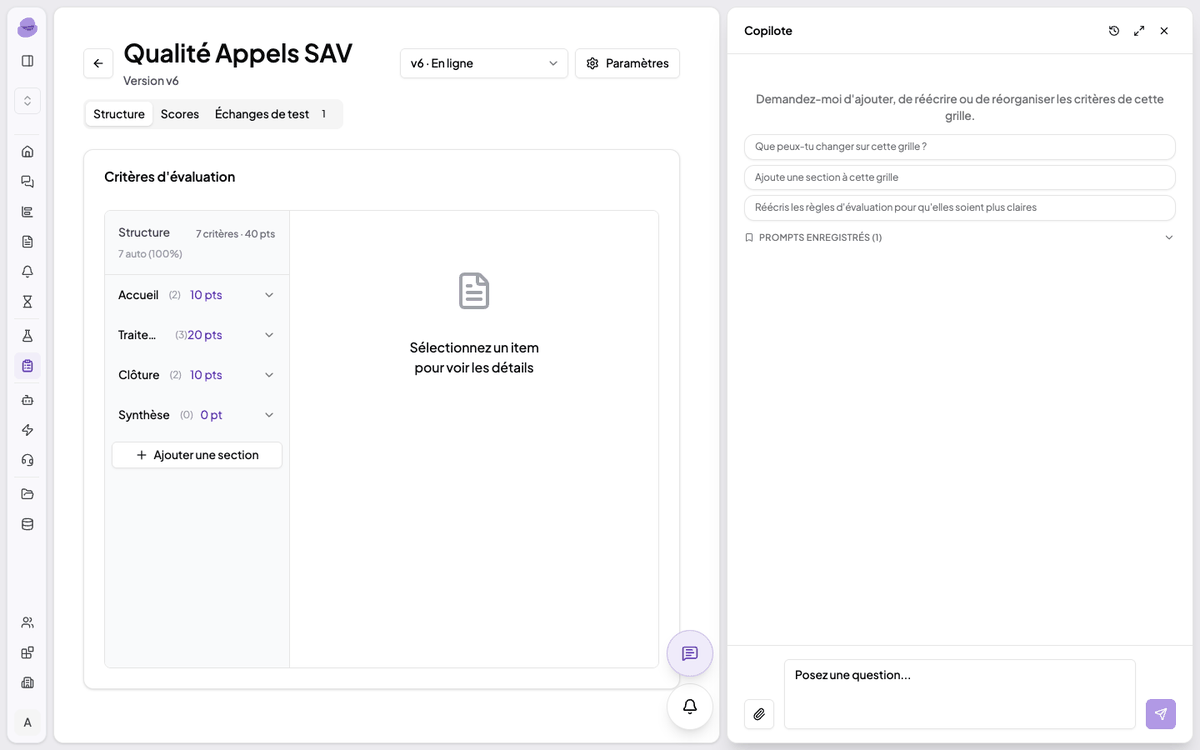
A version 6 "Online" grid, with the Co-Pilot ready to adjust the criteria.
Changes made to a custom analysis or evaluation grid remain in a private draft until you publish it, and each publication retains a version.
A rating remains associated with the version it was assigned to.
A selector allows you to review a previous version and restore it to a new draft.
The name and scope are configured separately, without creating a version.
When the Co-Pilot drafts criteria, they also write in the draft; only you can publish it. They agree to revise a template that has already been used.
Profit
Update a reference framework without disrupting ongoing evaluations, while ensuring that the history remains clear.
Use Cases
Revise the quality matrix for the launch of a new offering without disrupting the evaluations for the current month.
Compare the quality before and after a change in the reference standard, with each period still labeled according to its respective version.
Test the analysis on a few conversations before publishing
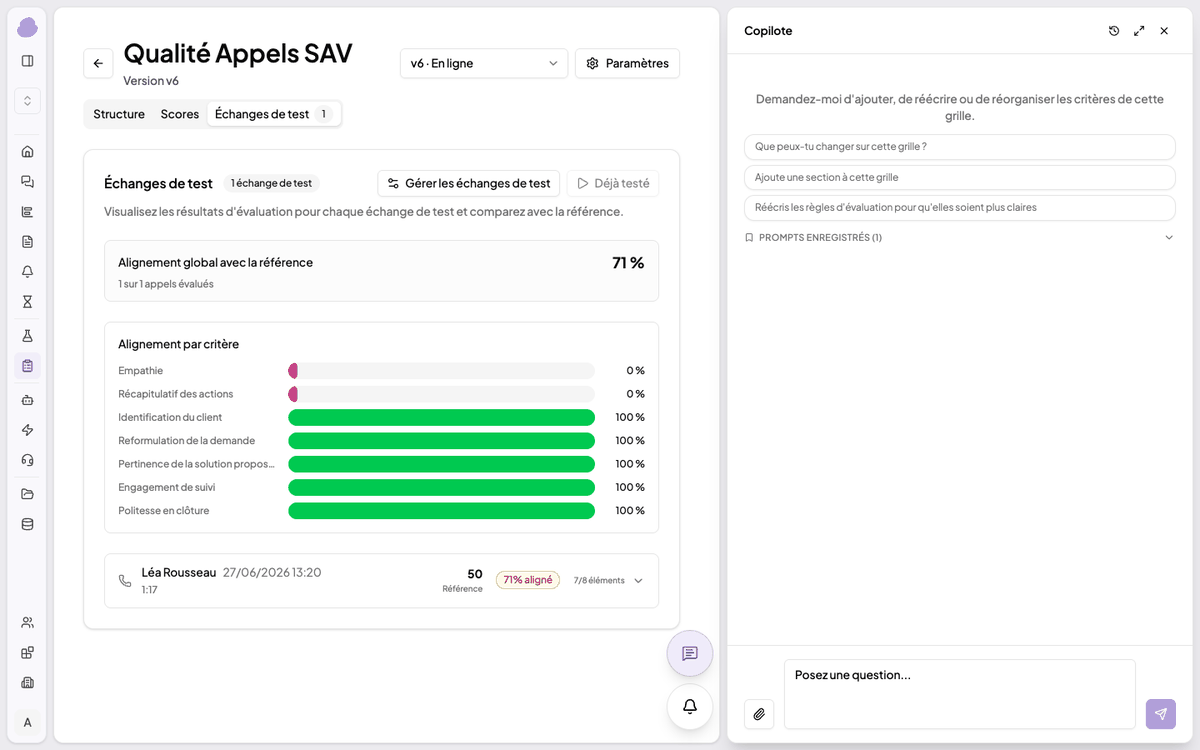
Test results: overall alignment with the reference, followed by a comparison criterion by criterion.
You link a small sample of existing conversations to an analysis, run the version you're currently writing against it, and compare the results with those produced by the version currently in use. The test runs on the draft without publishing anything, and the production results remain unaffected. A conversation is added to the tests from its details panel.
Profit
View the effect of a change on known conversations before implementing it.
Use Cases
Refine the detection of complaint patterns based on ten known calls before applying it to thousands of calls per month.
Verify that a new “intent to terminate” field is clearly evident in typical cases before bringing it before the committee.
Have the business team validate the analysis using concrete examples before it goes live.
Pause an analysis without losing the results
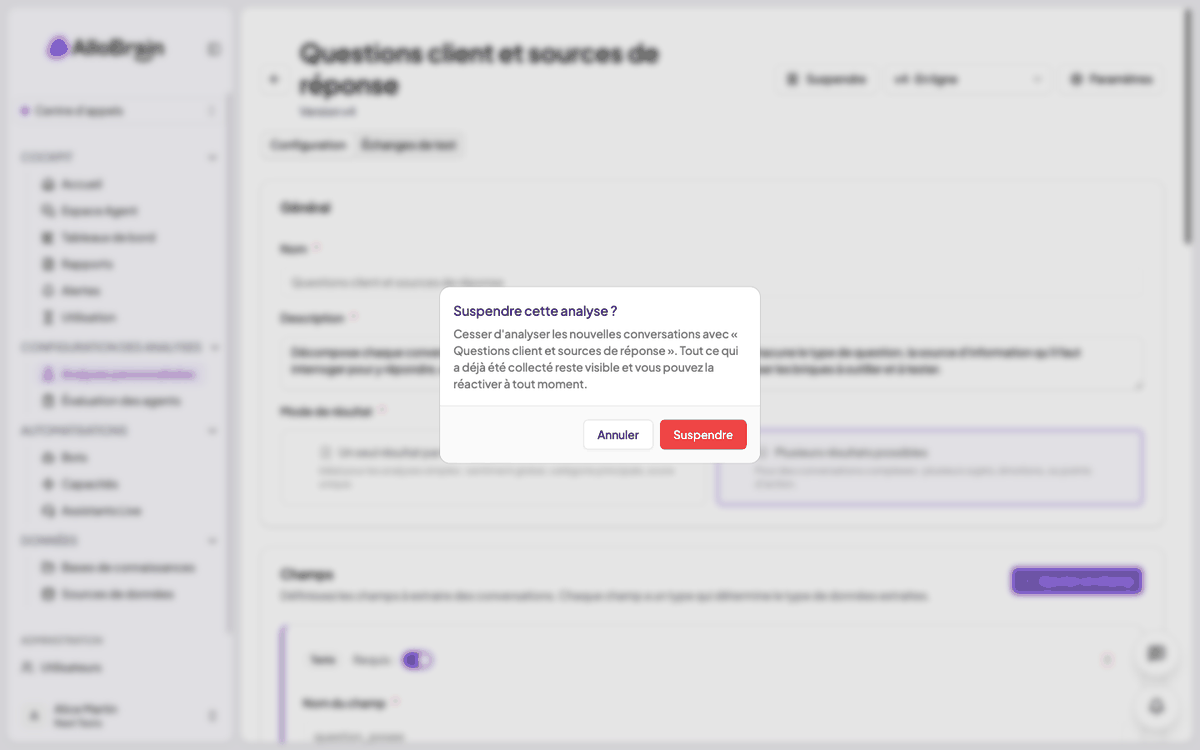
Confirmation before pausing an analysis.
An analysis can be paused: it stops applying to new conversations, and everything it has generated remains visible. It resumes with a single click, without recalculating anything. Your existing analyses already cover day-to-day events, campaigns, incidents, or spikes in activity, so there’s no need to create a new one for each one: the pause feature is intended for temporary analyses.
Profit
Keep the analysis repository clean without deleting any existing data.
Use Cases
An exploratory analysis, initiated to test a business hypothesis, is paused once the answer is obtained, and its results remain available for review.
A calibration analysis, used to adjust a grid, that is stopped as soon as the adjustment is validated.
Grades are in good hands
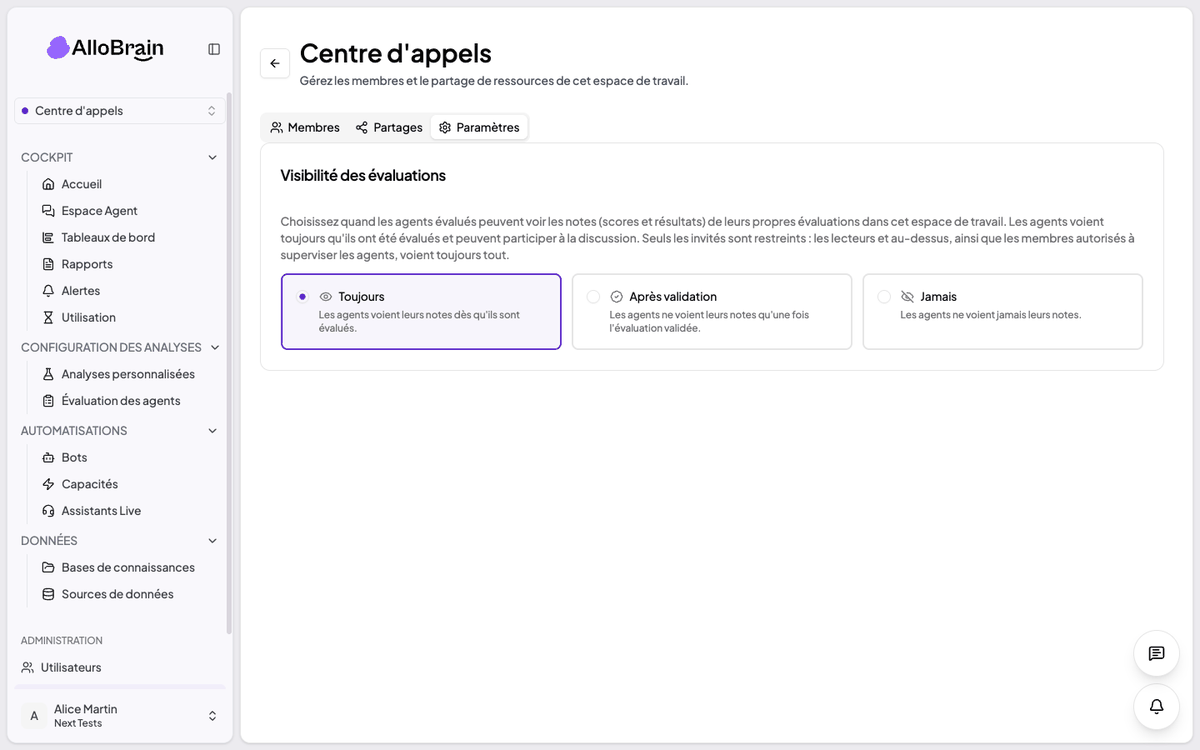
The setting for the visibility of evaluations in the workspace settings.
The visibility setting for evaluations applies to invitees. An evaluated person can always view their own evaluations, including the AI’s explanation and the discussion. When this setting is enabled, only the scores are hidden, and they are hidden everywhere: in the details view, in the PDF export, and in Copilot.
Profit
The advisor has access to their feedback, while the manager retains control over when the rating becomes visible.
Use Cases
A manager approves the evaluations before the one-on-one meeting: the advisor reads the detailed feedback and responds to it; the rating is assigned after approval.
An external service provider receives its advisors' evaluations without the scores during the calibration period.
Data Sources
Import Conversations in Bulk
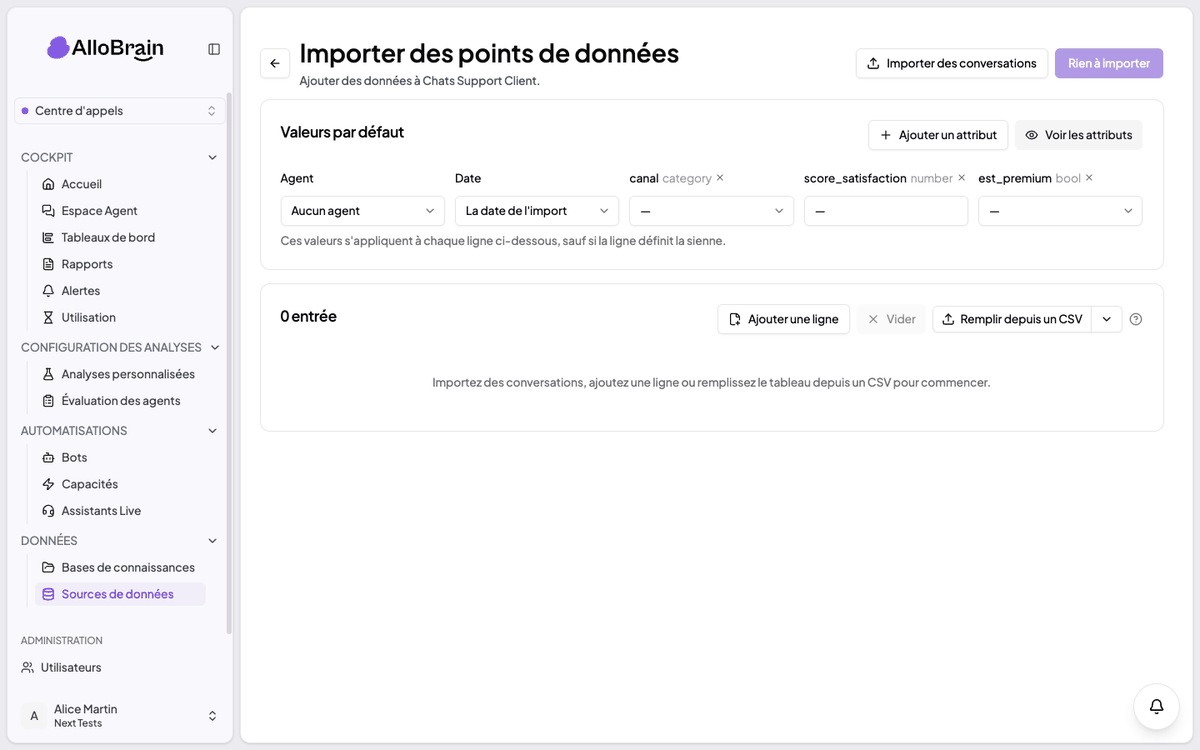
The batch import screen: default values, rows, importing from a file.
An import screen can process an entire batch of conversations—up to fifty items at a time.
Audio recordings, or written transcripts in spreadsheet or JSON format for chat and email, that can be read immediately without waiting for a transcript.
An entire file can be submitted all at once.
The advisor, date, and attributes can be set for the entire batch, line by line, or using a correspondence file—a template for which is available for download.
Before importing, each issue is flagged along with the corresponding line: duplicate, unsupported format, date in the future, unknown advisor.
Profit
Populate a data source yourself, in just a few minutes, with the context of each conversation.
Use Cases
A pilot project launched in one morning based on fifty chat conversations exported from the ticketing tool.
Catching up on a day's worth of calls from a site that is not yet connected to the platform.
Responses from a satisfaction survey were imported to cross-reference them with calls from the same period.
● AvailableAugust 2026
Available on the platform—no action required on your part.
Clear, easy-to-understand charts; alerts that hit the mark
This version lets you understand each chart with a single click, opens conversation segments directly in the dashboards, speeds up the creation of views, refines multidimensional alerts, and adds Arabic to the interface languages.
Co-pilot
Each graph is explained
Some charts are inherently complex, and others have filters applied from the outset—filters that not all users are necessarily aware of. Here are two ways to understand exactly what a widget is showing:
Ask it a question via Copilot (“Ask a question about this widget”): it explains what is being tracked, how, and for which scope.
Click the widget icon, which shows the filters that have been applied.
The origin of each number can thus be verified with a single click at any time.
Dashboards
Conversation segments become available
The new "Segments" tab displays the conversation segments that actually match the search term or the applied filters. Go from metrics to verbatim quotes in a single step, without leaving the dashboard.
Each segment lists its source, date, and agent.
The search terms are highlighted.
The original conversation opens with a single click.
Dashboards
Building views is faster
Fewer repetitive clicks, and everyone can pick up where they left off.
Duplicate a widget with a single click to create variations of it.
Allow the platform to name the widgets based on their configuration.
Pin your favorite filters: they'll be right at your fingertips from one session to the next, and are specific to each user.
Alerts
Alerts That Hit the Mark
Alerts and widgets now combine multiple dimensions of the same analysis—such as a topic and a sentiment. You can set up an alert to be notified when “delivery” appears alongside a negative sentiment in just a few clicks: you’ll be alerted to the specific combination that interests you, not the topic in general.
Platform
The interface is available in Arabic
In addition to French and English, the entire interface is available in Arabic, with a right-to-left layout designed for natural reading. Each user selects their language, and the platform remembers it.
And also
More enjoyable, more reliable, everywhere
The platform is constantly improving, and your feedback directly contributes to that improvement.
Standardized dates, more streamlined lists, and clearer navigation.
Administrators invite a user with the appropriate spaces and permissions as soon as the invitation is sent.
A series of fixes based on your feedback: restored quality of anonymized audio, filters that remain unchanged even when an analysis is modified, and improved stability of dashboards with extensive graphics.
Behind the scenes: ongoing improvements to security and data compartmentalization, and enhanced performance when handling very large volumes of conversations.
● AvailableJuly 16, 2026
Available on the platform as of that date.
A bilingual platform, a Copilot that cites its sources
This version makes the interface fully available in French and English, adds clickable sources to Copilot's responses, and revamps the "Usage" page with a dedicated section for Live Assist.
Platform
The interface is now available in French and English
Internationalization now covers the entire application: alerts, data sources, custom analyses, the agent dashboard, evaluation grids, knowledge bases, Live Assist, and audit logs are displayed in the language of your choice.
Dates, durations, and numbers automatically follow the format of the selected language.
The language change takes effect immediately, without reloading the page.
Co-pilot
Answers with clickable sources
When Copilote includes direct quotes in its response, a “cited sources” block appears below it, with one card per excerpt: a summary of the quote, the conversation, the attribution, and the date.
Clicking on a map opens the cited conversation in a window, centered on the relevant excerpt.
Quotes are directly linked to actual data: Copilote cannot invent a source.
Sources remain clickable when you reopen an existing Copilote conversation.
Usage
A page on fairer and more readable usage
The Usage page has been reorganized into two tabs (“AlloIntelligence” and “Transcription & Anonymization”), featuring a detailed breakdown by map and a new Knowledge Bases map.
The count now accurately reflects the analysis work performed: each grid element and each custom analysis counts as one analysis.
When a evaluation is rerun, only the elements that are actually reanalyzed are counted: results that remain unchanged are not counted a second time.
Live Assist
Usage Tracking for Live Assist
A new "Live Assist" tab on the Usage page provides insight into real-time support activity.
Hours of support, number of calls, and number of active support staff during the selected time period.
Detailed breakdown by assistant and by staff member.
Reviews
More Reliable AI Evaluations
The quality of automatic evaluations is improving significantly, with a particularly marked improvement in Arabic conversations.
When a criterion does not apply to a conversation (no actual exchange, condition not triggered), the item is now marked as "not applicable" instead of being rated at the lowest level.
Integrations
Agent-Initiated Live Assist Sessions via Email
Phone integrations can now create a Live Assist session by identifying the agent by their email address—which is useful for systems that do not know the agent's internal ID.
● AvailableJuly 9, 2026
Available on the platform as of that date.
Live Assist · Option to Record and Detection of a Refusal
It is now possible to disable an assistant’s recording (audio and transcript) and to detect during a call that a caller objects to being recorded, in order to stop the assistant. This is a real issue of consent and trust.
User-Friendliness of the Co-Pilot and Live Assist
You remain in control of the scrolling while the co-pilot types: you can read the beginning of a response at your own pace.
Copilot · New Features
The now-unified copilot offers three new features: it applies all the dashboard filters; it provides clickable links to the conversations cited as examples; and it saves and reuses prompts along with a history of exchanges. This last feature is a welcome replacement for a previously popular function: generating dashboard summaries and saving summary templates. More detailed and reusable analyses, with direct access to the conversations cited.
Historical QM/VoC Customers · Continuity Without Regression
Implementation of the following features from the current tool on the new platform: exporting VoC dashboards, generating PDF reports, and copying data from a chart (to retrieve all the chart information, just as on the old platform).
Dashboard · Comparison, Interactivity, and Speed
The ability to compare two time periods—already available for KPIs, lines, and bars—has now been extended to pie charts and lists. The charts are now clickable to filter the dashboard, which significantly improves usability. And query caching significantly reduces load times.
Real-time translation of conversations
A user can translate a conversation into their own language (FR / EN) to read, evaluate, and make use of it, even if the conversation took place in another language.
Copilote · Active Filters, Ad Hoc Analyses, and Relevance
The co-pilot can now see all active filters and can remove a specific one or reset them all at once while retaining the time period; its summary reflects the scope that was actually applied and flags a conflict rather than returning an empty result. CSAT, NPS, and histogram analyses are calculated and displayed correctly; filtering by category once again returns the correct results (and prompts for clarification in case of ambiguous names); and the copilot displays only the actions relevant to the current page.
Analysis & Evaluation · Easy-to-read comparisons and AI categories preserved
In a comparison widget, a missing value from the previous period now displays a true 0 for count/sum metrics (averages, scores, and ratios still display a dash). And editing an analysis no longer resets only the AI categories of the field that was actually modified: the others retain their previous values, without unnecessary regeneration. This ensures clear comparisons and preserves the category history.
Conversations & Agents · Identify the agent at a glance
Whenever a transcript is displayed (rating, conversation list, alert), the agent's tooltip includes their name and a link to their profile; the name also appears in the conversation list on a dashboard.
Live Assist · Expanded Rejection Detection
Refusal detection is being expanded: refusals are recognized based on context (using AI, recording, or analysis), beyond standard phrasing. The safeguard remains in place: a question, a simple mention of AI, or a moment of hesitation will not trigger the system to stop.
● AvailableJune 25, 2026
Available on the platform as of that date.
Dashboard · New Quality Analyses
Three charts round out the quality monitoring, with new applications:
Changes in the quality score: Determine whether quality is improving or declining over a period of time.
Score Distribution: The breakdown of conversations by score range—that is, the proportion of high- and low-performing conversations—beyond just the simple average.
Top Trends: Identifying weak signals—topics experiencing sharp increases or decreases and newly emerging categories—to spot them early.
In addition, several usability issues with the dashboard have been fixed.
Unified Copilot: QM + dashboard all in one place
Two previously separate co-pilots are now combined: the coaching co-pilot (on the Quality Monitoring side: analyzing an agent’s performance) and the dashboard co-pilot (analyzing a dashboard and conducting qualitative analyses of conversations). Now combined, the co-pilot can be used across a wider range of pages: you can engage in dialogue on both the dashboard and in evaluations to provide coaching, and cross-reference Voice of Customer (customer-focused) and Quality Monitoring (agent-performance-focused) data—which makes perfect sense on a unified platform.
Agent Area
A page dedicated to an agent, which their team leader or supervisor can view to focus on the agents on their team. At this stage, it displays a list of the Live Assistants the agent has access to (and allows them to be launched directly from the page), as well as all calls made by the agent, whether they have been evaluated or not.
Data Accuracy and Segregation
Enhanced isolation of analytics between workspaces, deduplication of the conversation list, and improved reliability of filters and synchronization during bulk imports. Accurate, up-to-date, and segmented data.
Live Assist · More Comprehensive Assistance
Increased the character limit for prompts (up to 5,000) to support more feature-rich wizards, and verified access permissions for assisted calls.